
Dynamics

|
Generational Dynamics |
| Forecasting America's Destiny ... and the World's | |
| HOME WEB LOG COUNTRY WIKI COMMENT FORUM DOWNLOADS ABOUT | |
For the first time, analysts are debating whether the stock market is crashing.
If you've been reading or watching the business news this week, you might have thought that the stock market fell a little, but it's just been "more of the same" that we've seen over and over again.
But the business news programs have not been fully straightforward about this.
This past week has NOT been "more of the same." Stock markets around the world have been going up steadily for about 2-3 years now. Whenever one market fell, another market would pick up the slack, and then the upward trend would continue. Sometimes you could almost trace how the money moved from market to market.
But not the past couple of weeks. Markets around the world ALL fell, usually by 2-6%. The question of a stock market crash is being raised, and even normally optimistic analysts are talking about a "healthy correction" during the next 3-6 months, and occasionally you even hear a debate about whether we're headed for a crash.
Let's take a look at some examples of what's been happening:
 |
 |
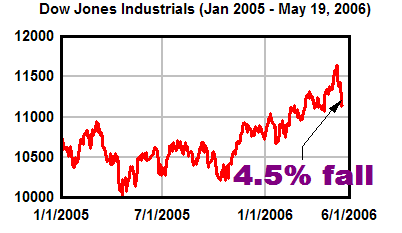
On May 10, the Dow Jones Industrial Average (DJIA) reached 11642.65, and appeared to be within reach of the all-time high of 11723 that it reached on January 14, 2000. Instead, it fell 4.5% to 11128 on Thursday, before recovering slightly on Friday.
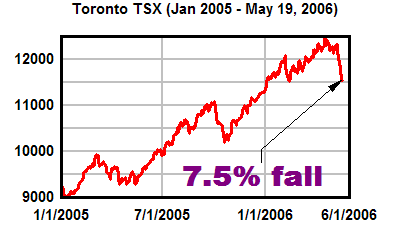
The Toronto Stock Exchange (TSX) did even worse, falling 6.4% over the last 8 days, and 7.5% since it reached its peak on April 19. This is a very big deal for Canada, which has some 70% of the entire nation's assets in the TSX, and so a meltdown affects every Canadian.
 |
 |
While the Wall Street markets fell around 2% this past week, the European markets uniformly lost 4-5% during the past week alone. The London FTSE index fell 7.8% since it peaked on April 21.
It was just one short month ago that India's financial analysts were wildly cheering and celebrating the BSE index passing 12,000. The index continued going up and peaked at 12612.38 on May 12. What was especially remarkable is that the BSE had gone from 11,000 to 12,000 in just one month, the fastest 1000 point increase in history, but by May 19 it had fallen 13.2% or over 1500 points in just nine short days.
 |
 |
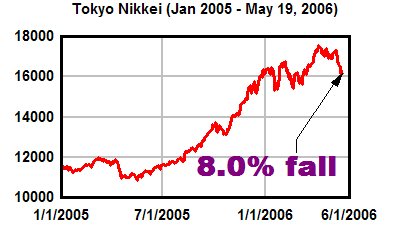
The Tokyo Stock Maket's Nikkei is a bellwether for Asian stocks, and it's also been falling sharply.
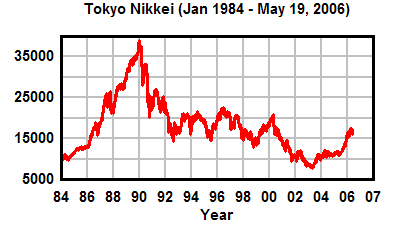
Tokyo is an interesting case because they've already suffered an enormous crash. During the 1980s there was a stock market bubble and also a real estate bubble, and by the end of the decade the value of Tokyo's real estate was greater than the value of all the real estate in the United States!
The Nikkei was at 38916, and then fell sharply and deeply, starting on January 1, 1990, and continued falling for years, reaching an all-time low of 7607 on April 28, 2003.
As you can see from the above examples that markets around the world fell last week, as investors pulled out their money.
Where did the money go? Where did they put their money after pulling it out of stocks? Did they put their money into commodities?
Well, no. commodity prices melted down last week too. Take a look at gold prices:
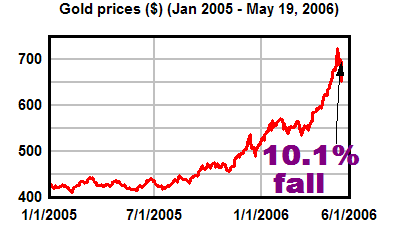 |
The collapse in gold prices should be quite a surprise to a lot of people. The various "gold bugs" have been predicting that gold would continue to rise through the roof, as the dollar collapses, a claim that I've always found dubious, even in the face of a stock market crash.
At any rate, gold prices fell the same as stocks. The same is true of oil, copper, and other commodities.
In fact, all of the above graphs look pretty similar, and that's the point: What's happening in Wall Street is happening around the world.
So what happens now? In the last week, markets all over the world have fallen 2-6%, and the underlying fundamentals haven't changed -- the enormous American debt, the increasing instability of China, the fact that the Gaza Strip is very close to civil war, the unraveling of global carry trade and hedge fund positions as Japan moves to abandon its "zero interest rate" policy, the end (last October) of the housing bubble, and so forth.
Long-time readers of this web site know that since 2002 Generational Dynamics has been predicting a stock market crash to the 3000-4000 range, probably by 2006 or 2007. But that prediction has always "felt" far off -- until this year. And now, with markets falling around the world, it seems closer than ever.
What's certain is that investors are increasingly risk-averse. I've pointed this out several times in the last few weeks, and when you see money being pulled out of markets around the world, the only possible conclusion is that risk-averseness is increasing.
In fact, investors appear to be completely unraveling their positions, and taking profits before things get worse. This will cause the pyramid to collapse.
Recently Warren Buffett, considered by many to be the most astute investor in the world, described bubbles as follows:
What's going on now is that a group of investors have decided that it's almost midnight, and they've decided to get out.
It's not a stampede, because there are still plenty of people at the ball. When the stampede occurs, everyone will know it, because there'll be a big, old fashioned stock market panic.
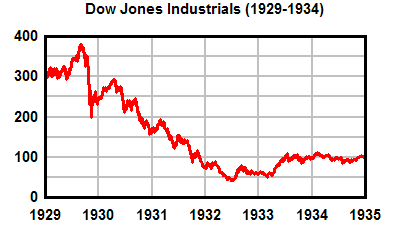
Here are graphs showing the last two major Wall Street panics, the panics of 1929 and 1987, for comparison to the previous graphs:
 |
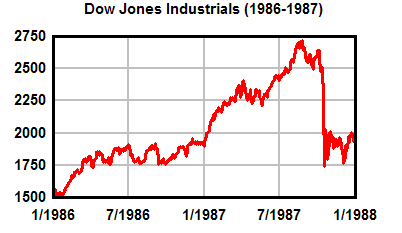 |
The above two graphs appear to be rather similar, and you would expect the follow-on to the panics of 1929 and 1987 to be similar, but in fact they were quite different. The following two graphs show what happened in the four years following each of the panics:
 |
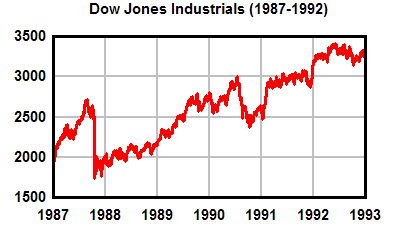 |
From these two graphs you can see why I call the 1987 panic a "false panic": recovery was rather swift. What's the difference between the two situations?
As I explained a few days ago, the big difference between the two is that stocks were far overpriced prior to the panic of 1929, as measured by price/earnings ratios, so they had very far to fall, and in 1987 stocks were underpriced or moderately priced, so really didn't have anywhere far to fall.
But what's happened is that the false panic of 1987 had a mesmerizing effect on analysts. The older generations had been preaching caution, because they had lived through the Great Depression, and the younger generations were sick of all the preaching. 1987 was 58 years after the crash of 1929, exactly the time when the the older generation retired. The quick recovery from the false panic allowed the younger generations to say, "I knew you were just blowing smoke" to the older generations. And that was the end of the decades of caution following the Great Depression.
That led to one crazy investment after another, causing the great bubble of the late 1990s, and it led people like new Fed Chairman Ben Bernanke to believe that stock market crashes were old things, no longer anything to worry about. However, thanks to to the 1990s bubble and the Fed's near-zero interest policy of the last few years, stocks are again way overpriced according to price/earnings ratios, and have been so for over ten years. So we're headed for a panic and major new 1930s style Great Depression with absolute certainty.
The only remaining question is when the next panic will occur. A panic is a "chaotic event," and it's impossible to predict the date of a chaotic event. One can only estimate the probability of the panic occurring during a range of time.
We now have the following collection of facts that I've discussed here and in previous postings: a stock market crash must occur, almost certainly within the next year or two; the national and global financial situation continues to deteriorate; markets around the world have fallen sharply, though we haven't yet had an official "panic"; and even optimistic analysts are predicting 3-6 months of further volatility and weakness in the stock markets.
From these facts, it's possible to conclude that a full-scale panic will probably occur within the next few weeks or months, possibly as early as Monday or next week.
This is not a certain prediction, but a probabilistic prediction -- it now appears that the probability is greater than 50% that a panic will occur within the next few months, possibly very soon.
I try to maintain a strict discipline on this web site, so that readers will know what's coming as well as it's humanly possible to know. I make no money from this web site (except for a very rare book sale), and I don't give investment advice, except informally. So I have nothing at stake except my credibility. There is no other web site in the world that does this, and no other web site with the 100% success record with predictions that this one has had.
So for all the Cinderellas out there reading this, what I'm telling
you is that if there were a clock on the wall it would be telling you
that midnight is approaching, and it's time to head for the door.
(21-May-06)
Permanent Link
Receive daily World View columns by e-mail
Donate to Generational Dynamics via PayPal
Web Log Summary - 2016
Web Log Summary - 2015
Web Log Summary - 2014
Web Log Summary - 2013
Web Log Summary - 2012
Web Log Summary - 2011
Web Log Summary - 2010
Web Log Summary - 2009
Web Log Summary - 2008
Web Log Summary - 2007
Web Log Summary - 2006
Web Log Summary - 2005
Web Log Summary - 2004
Web Log - December, 2016
Web Log - November, 2016
Web Log - October, 2016
Web Log - September, 2016
Web Log - August, 2016
Web Log - July, 2016
Web Log - June, 2016
Web Log - May, 2016
Web Log - April, 2016
Web Log - March, 2016
Web Log - February, 2016
Web Log - January, 2016
Web Log - December, 2015
Web Log - November, 2015
Web Log - October, 2015
Web Log - September, 2015
Web Log - August, 2015
Web Log - July, 2015
Web Log - June, 2015
Web Log - May, 2015
Web Log - April, 2015
Web Log - March, 2015
Web Log - February, 2015
Web Log - January, 2015
Web Log - December, 2014
Web Log - November, 2014
Web Log - October, 2014
Web Log - September, 2014
Web Log - August, 2014
Web Log - July, 2014
Web Log - June, 2014
Web Log - May, 2014
Web Log - April, 2014
Web Log - March, 2014
Web Log - February, 2014
Web Log - January, 2014
Web Log - December, 2013
Web Log - November, 2013
Web Log - October, 2013
Web Log - September, 2013
Web Log - August, 2013
Web Log - July, 2013
Web Log - June, 2013
Web Log - May, 2013
Web Log - April, 2013
Web Log - March, 2013
Web Log - February, 2013
Web Log - January, 2013
Web Log - December, 2012
Web Log - November, 2012
Web Log - October, 2012
Web Log - September, 2012
Web Log - August, 2012
Web Log - July, 2012
Web Log - June, 2012
Web Log - May, 2012
Web Log - April, 2012
Web Log - March, 2012
Web Log - February, 2012
Web Log - January, 2012
Web Log - December, 2011
Web Log - November, 2011
Web Log - October, 2011
Web Log - September, 2011
Web Log - August, 2011
Web Log - July, 2011
Web Log - June, 2011
Web Log - May, 2011
Web Log - April, 2011
Web Log - March, 2011
Web Log - February, 2011
Web Log - January, 2011
Web Log - December, 2010
Web Log - November, 2010
Web Log - October, 2010
Web Log - September, 2010
Web Log - August, 2010
Web Log - July, 2010
Web Log - June, 2010
Web Log - May, 2010
Web Log - April, 2010
Web Log - March, 2010
Web Log - February, 2010
Web Log - January, 2010
Web Log - December, 2009
Web Log - November, 2009
Web Log - October, 2009
Web Log - September, 2009
Web Log - August, 2009
Web Log - July, 2009
Web Log - June, 2009
Web Log - May, 2009
Web Log - April, 2009
Web Log - March, 2009
Web Log - February, 2009
Web Log - January, 2009
Web Log - December, 2008
Web Log - November, 2008
Web Log - October, 2008
Web Log - September, 2008
Web Log - August, 2008
Web Log - July, 2008
Web Log - June, 2008
Web Log - May, 2008
Web Log - April, 2008
Web Log - March, 2008
Web Log - February, 2008
Web Log - January, 2008
Web Log - December, 2007
Web Log - November, 2007
Web Log - October, 2007
Web Log - September, 2007
Web Log - August, 2007
Web Log - July, 2007
Web Log - June, 2007
Web Log - May, 2007
Web Log - April, 2007
Web Log - March, 2007
Web Log - February, 2007
Web Log - January, 2007
Web Log - December, 2006
Web Log - November, 2006
Web Log - October, 2006
Web Log - September, 2006
Web Log - August, 2006
Web Log - July, 2006
Web Log - June, 2006
Web Log - May, 2006
Web Log - April, 2006
Web Log - March, 2006
Web Log - February, 2006
Web Log - January, 2006
Web Log - December, 2005
Web Log - November, 2005
Web Log - October, 2005
Web Log - September, 2005
Web Log - August, 2005
Web Log - July, 2005
Web Log - June, 2005
Web Log - May, 2005
Web Log - April, 2005
Web Log - March, 2005
Web Log - February, 2005
Web Log - January, 2005
Web Log - December, 2004
Web Log - November, 2004
Web Log - October, 2004
Web Log - September, 2004
Web Log - August, 2004
Web Log - July, 2004
Web Log - June, 2004