
Dynamics

|
Generational Dynamics |
| Forecasting America's Destiny ... and the World's | |
| HOME WEB LOG COUNTRY WIKI COMMENT FORUM DOWNLOADS ABOUT | |
When I say we're going to have a stock market crash with 100% certainty, as I've been saying since 2002, it doesn't make much difference to anyone, since I'm basically a nobody. Mainstream financial publications and stations like The Wall Street Journal and CNBC have an editorial policy of avoiding negative views. To mainstream media, the stock market has nowhere to go but up, up and up.
|
So I was startled when I saw that the July 11 issue of Barron's has an article by Adam Barth titled The 11% Solution with the teaser, "The Dow has averaged an 11% return on equity over nearly 75 years. Everything else – earnings included – is just noise." I knew immediately that this article must be different, because you can't do a 75 year ROE analysis without concluding that we're headed for a crash. There's no other possibility. And the fact that none of the high-priced analysts that you see in publications and on tv have ever done a similar analysis just shows how stupid they are, which should not be a surprise given the incredible amount of gibberish we hear whenever they open their mouths. (The article can also be found online here.)
Very briefly, Barth shows that in any 20 year period (1920-39, 1921-39, etc.) since 1920, the stock market is surprisingly constant with respect to average earnings and growth. Therefore, this must be true for the period 1995-2014. The past 11 years have seen an enormous stock bubble which continues to this day, and so the next 9 years will have to compensate. Barth also has some pithy comments about the current practices of many financial analysts. He must be a man after my own heart.
I'm not quite sure what to make of seeing this article in a highly mainstream publication like Barron's, a sister publication of the Wall Street Journal. It might be a one-time thing, or it might be part of a larger trend where financial analysts and journalists are beginning to realize that we're headed for a crash. Such a realization would itself be the trigger for such a crash.
Barth found that average earnings for the 30 companies included in the Dow Jones Industrial Average (DJIA) are 11% of the company's book value in any 20-year period between 1920 and 1986 (1920-39, 1921-40, 1922-41, etc.). "Average earnings as a function of book value barely varies in the slightest, and has remained basically immune to inflation, wars, massive changes in the tax code or any other external factor," according to the article.
The significance is this: The stock market may go up or down from year to year, but over any 20 year period, the market is surprisingly constant and consistent. And it makes no difference what else is going on.
According to the article,
The popular notion that the long-term earnings growth rate is highly variable and affected by the daily news that speculators, economists and the media slavishly focus on is a great red herring."
The "book value" of a company is determined by standard accounting methods. In simplest terms, it equals the cost of the company's assets (real estate, inventory, etc., plus intangible assets like goodwill) minus accumulated depreciation (loss of value from wear and tear, etc., over time) minus the company's debts and liabilities.
What's useful about the book value is that it's a solid, well-defined representation of a company's real value. By contrast, you can compute the value of a company from its stock market value (the number of outstanding shares x the price per share; this is called the "market capitalization.") However, this computation is subject to the vagaries of the stock market, and can gyrate wildly.
The book value of the market generally grows steadily over time, while the stock market valuation gyrates wildly. However, over a long period of time there is a relationship between the two.
According to the article, "the Dow's book-value growth rate has remained near its 4.8% historical average from 1920 to 2003 for every 20-year period on record." That is, book values grows at 4.8% per year, consistently in any 20-year period. This makes sense, because if you compute the average growth in the DJIA from 1896 to 2002, you find that the DJIA grows at 4.6% per year. So book value tracks stock prices over the long run, and both grow at 4.6-4.7% per year.
Because of the remarkable consistency of book values and earning growth over any 20 year period, the return on equity (ROE) must also grow at 11%. (The ROE is the amount of money earned by investing in the stock market.) However, the ROE has been 18% during the last decade, since the start of the stock market bubble.
Since history tells us that the average ROE will be 11% for the 20 year period from 1995 to 2015, it therefore follows that ROE will by much lower in the next decade. The ROE was 7% (18% - 11%) above average in the last decade, so will have to average 7% below average (11% - 7% = 4%) in the next decade.
According to the article:
Although there have been many short periods in the past during which the Dow Industrials' return on equity significantly exceeded 11% (such as the 1920s, when it also averaged 18%), an elevated return on equity has always come at the expense of future profits, and ROE has always reverted near its 11% average over each 20-year period. While the causes (excess credit creation, faulty accounting) may be contested, the results are incontestable.
Putting history aside, basic logic alone dictates that a sustained 18% ROE is impossible. A return of this magnitude would mean that American business as a whole is capable of lasting, monopoly-type profits. The truth is the exact opposite."
Thus, history tells us that we're going to have a major stock market adjustment, with near certainty.
The article does a computation that shows, essentially, the stock market value of a DJIA company should equal 1.5 times its book value. It then finds:
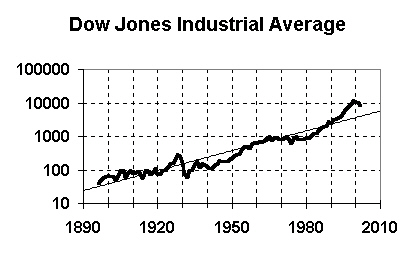 |
This is entirely consistent with my own findings. I've been predicting since 2002 that we were entering a 1930s style Great Depression, and that the stock market would fall to the Dow 3000-4000 range by 2006-2007. This prediction was based mainly on the adjoining graph. It plots the DJIA since 1896 along with an exponential trend line. The trend value in 2005 is 4670, which is very close to the 4500 value that the article computes.
It's interesting that he and I use entirely different methodologies and come out with the same result, but in the end we're both working from the same historical DJIA figures, so perhaps it isn't so surprising.
Barth also ridicules the way that today's analysts and investors are using P/E ratios (also called "valuations").
I've frequently commented on the bizarre gibberish that mainstream financial journalists and analysts say about price/earnings ratios. I'd like to review some of this before turning to Barth's comments.
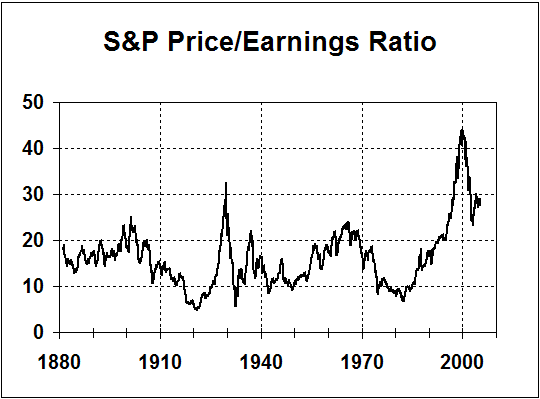 |
Price/earnings ratios are computed by dividing the price of a share of stock by the company's earnings per share. The adjoining graph shows the value of the average P/E ratio for the S&P 500 since 1880. There are three points worth noting about this graph:
Today, the P/E ratio index is about 26, and it's been above 20 for 10 years, since the beginning of the 1995-2000 bubble.
If you've seen the P/E ratio index discussed elsewhere, you may be surprised by these results, since many high-priced analysts give the current index as around 16 or 17.
In fact, if you look at the bottom of the home page of this web site today, you'll see the following graph:
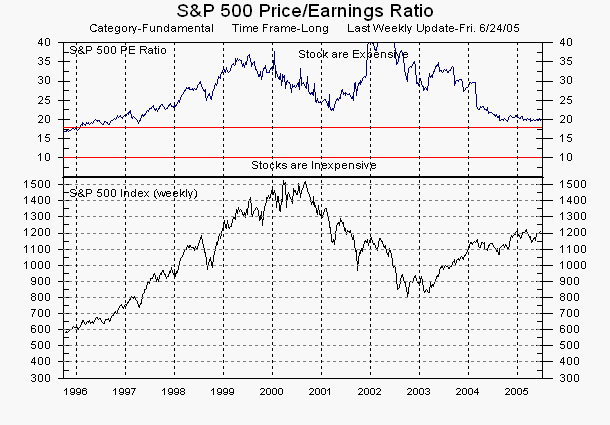 |
This graph clear shows the current P/E ratio index at about 20, much lower than 26. What's the difference? It's because the two graphs use different definitions of "earnings." The first graph uses P/E10, the company's average earnings over the previous 10 years; the second graph uses P/E1, the company's earnings during the previous year.
The second graph shows a lower index today because earnings were especially high in 2003 and 2004, as companies laid off workers to save money. I personally prefer P/E10 for my work because it smooths out bumps like one-year up or down spikes in earnings.
Now, you can actually use either of these definitions of "earnings," but whichever one you use, you have to use it consistently. In particular, the historical average value of P/E1 is lower: 14.8 for P/E1, rather than 16.1 for P/E10.
Other values for earnings are possible. Some analysts compute the index as P/Epeak, using "peak earnings," the highest one-year earnings value that the company has ever achieved. This method, which yields a historical average of 14, is OK, provided that it's used very carefully, but I dislike this method because it's too easy to abuse, and because it gives distorted values following a one-year earnings spike or bubble -- like today.
To show how this P/Epeak computation can be abused, look at the following graph from a recent article on the Mckinsey & Company web site, entitled "Do fundamentals — or emotions — drive the stock market?," by Marc Goedhart, Timothy Koller, and David Wessels:
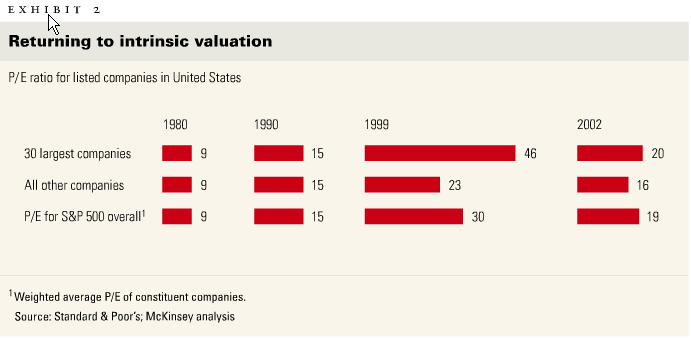 |
Now, how in heaven's name did these authors come up with a P/E ratio of just 19 in 2002, when the previous two graphs (of P/E10 and P/E1) show values in the high 30s and 40s?
Answer: They used "peak earnings" to compute P/E, and probably made other "adjustments" as well.
According to the authors:
This paragraph is such gibberish that Marc Goedhart, Timothy Koller, and David Wessels ought to be sued for fraud by anyone dumb enough to take their advice. There are two major problems:
These are the kinds of sloppy errors we see time after time from high-paid financial analysts today. I've seen enough to be able to say without doubt that 95% of them don't have the vaguest notion of what they're talking about. In this case, we can use Goedhart's, Koller's and Wessels' own figures to show that they imply that today's stock market is overpriced by more than 100% -- exactly the same conclusion reached by me and Adam Barth.
There's one more method of earnings computation that some financial analysts use to fudge the data. They compute "P/Eforward," where "forward earnings" refer to next year's earnings.
And how do you get next year's earnings? Why, from analysts' estimates of course.
Today, analysts are using inflated estimates of next year's earnings to compute a P/E ratio which is lower than it should be, in order to justify the high valuations for stocks they're recommending.
Barth's conclusion is as follows:
In response to this challenge, many investors have turned to a relative, rather than absolute, value approach.
The problem is that these investment approaches are radically different, despite some seeming similarities. In choosing relative value, investors subject themselves to the value of the broad market.
This is not a prudent choice, given the current valuation of large-cap U.S. stocks and the limits to these companies' profitability and growth, as demonstrated by the 11% solution."
When I developed Generational Dynamics in 2002, I quickly found that it implied that we're entering a new 1930s style Great Depression, and I predicted so at the time.
I gave three reasons why this is so. Two of the reasons, based on exponential growth and price/earnings ratios, respectively, are similar to the reasoning in Adam Barth's article, and were presented earlier.
|
The third reason is a generational argument: The 1990s bubble occurred at exactly the time that the generation of senior financial managers who grew up during the 1930s Great Depression all disappeared (retired or died) all at once.
During the 1950s-1980s, when all our nation's leaders had lived through the starvation, homelessness, unemployment and devastation of the Great Depression, there was a strong national determination to be fiscally sound, so that the Depression would not repeat itself. This feeling lasted as long as our nations leaders were from a generation that had actually lived through the Great Depression.
During the 1980s, Republicans and Democrats got together and agreed on difficult changes to Social Security, and then got together again and agreed on difficult budget rules to reduce the deficit. Today, a generation later, Republicans and Democrats can't agree on anything beyond blaming the other side for not being able to agree on anything. The result is that no one is doing anything about the exponentially increasing public debt.
Generational Dynamics predicts that we're entering a new 1930s style Great Depression. This is confirmed by articles like The 11% Solution. The only thing we don't know is when the crash will come -- next week, next month, next year, or later. But it's coming, and it's coming sooner rather than later.