|
|


|
Economic Cycles
 |
Global technology cycles - Kondratieff cycles |
 |
Generational cycles and bubbles |
 |
A new "Great Depression" |
|
|
|


|
The 1930s Great Depression
|
 |
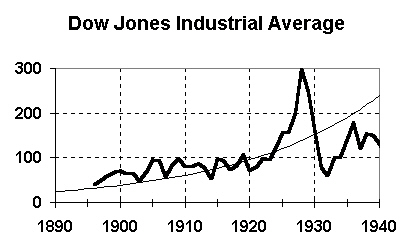
Dow Jones Industrial Average - 1896 to 1940
|
 |
Characteristics of 1930s Great Depression |
|
- |
Big credit bubble in 1920s - borrowed money to bid up stock prices |
|
- |
Nobody knew what was going on until a month into stock market crash |
|
- |
1920s stock market bubble CAUSED the 1930s Great Depression |
|
- |
Establishment of SEC and stock market regulations specifically designed to prevent another credit bubble |
 |
1929 collapse |
|
- |
Stock market became increasingly volatile |
|
- |
Below a certain level hit a 'tipping point' |
|
- |
People forced to sell to meet margin credit requirements |
 |
Previous big credit bubbles |
|
- |
Panic of 1857 (prior to Civil War) |
|
- |
British banking failure in 1772 |
|
|
|


|
The 1990s Credit Bubble
|
 |
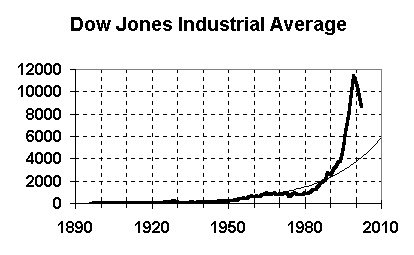
Dow Jones Industrial Average - 1896 to 2002
|
 |
New 1990s credit bubble (using stock options) |
 |
Complete failure of SEC and stock market regs |
 |
Trend line (exponential) |
|
- |
Current (early 2003) value: Above 10000 |
|
- |
Trend value in 2010: 5800 |
|
- |
Predicts fall to around 4000 in next few years |
|
|
|


|
Credit bubbles - logarithmic scale
|
 |
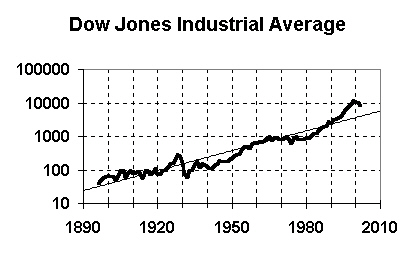
Dow Jones Industrial Average - 1896 to 2002
|
 |
Graph now shows both credit bubbles |
|
|
|


|
S&P 500 Index, adjusted for inflation
|
 |
S&P 500 Price Index - 1870 to 2002
|
 |
For those who consider the DJIA to be too artificial |
 |
Trend line (exponential) |
|
- |
Current (early 2003) value: Above 1100 |
|
- |
Trend value in 2010: 589 |
|
- |
Predicts fall to around 400 in next few years |
|
|
|


|
S&P 500 Price/Earnings Ratio
|
 |
S&P 500 Price/Earnings Index - 1881 to 2002
|
 |
P/E Ratio measures price of stock vs historical earnings |
|
- |
Historical average around 13 |
|
- |
Above 18: Stocks are expensive |
|
- |
Below 10: Stocks are inexpensive |
|
- |
Historically goes below 10 after exceeding 20 |
|
- |
Predicts stock market fall of 50% or more |
|
|
|


|
Generational Economic Cycles
 |
Credit bubbles every 70-90 years (generational cycle) during 'unraveling' period |
|
- |
Credit bubble / depression creates a risk-aversive generation |
|
- |
New bubble when previous risk-aversive generation retires |
|
- |
Financial crisis and war crisis reinforce each other |
 |
"Crusty Old Bureaucracy" theory |
|
- |
Informal (not rigorous) explanation |
|
- |
Every organization becomes bureaucratic in time - bankruptcy |
|
- |
Same rules applies to entire nation in 70-90 year cycles |
|
|
|


|
Greenspan and the Federal Reserve
 |
Greenspan in 1997 |
|
- |
Had referred to "irrational exuberance" |
|
- |
Knew that a stock market bubble was forming |
|
- |
Decided to deal with consequences rather than end bubble |
 |
Federal Reserve after 2000 |
|
- |
Prevent 1929 forced selling 'tipping point' |
|
- |
Reduced interest rates (overnight funds rate) to 1% |
 |
Consequences of low interest rate |
|
- |
Increased personal borrowing during unemployment |
|
- |
Extension of stock market bubble |
 |
Medium range risks |
|
- |
Collapse of Chinese credit bubble |
|
- |
Oil disruption through Mideast war |
|
- |
Loss of confidence after terrorist attack |
|
- |
Cyclic downturn spiraling down |
|
|
|


|
Technology (Kondratieff) versus Generational Cycles
|
 |
Technology cycles versus generational bubbles
|
|
 |
Identifying technology cycles |
|
- |
Smooth the S&P index, ignoring bubbles |
|
- |
Cycle length 40-50 years |
|
- |
Technology (Kondratieff) cycles have been identified for hundreds of years |
 |
Technology versus Generational cycles |
|
- |
Technology cycles are global, generational cycles are local |
|
- |
Entirely independent - can enhance or cancel each other |
|


