Dynamics

|
Generational Dynamics |
| Forecasting America's Destiny ... and the World's | |
| HOME WEB LOG COUNTRY WIKI COMMENT FORUM DOWNLOADS ABOUT | |
The phrase "bond yields are flattening" is fairly technical, but it carries a great deal of meaning, and is worth learning a little about.
If you lend money to me, you're going to charge me interest. If you lend me money for a year, you might decide to charge me 5% interest for the year. But if you're going to loan me money for ten years, then you'll want to charge more interest, say 10% per year, because your risk is higher. After all, I'm more likely to go bankrupt in ten years than in one year, so you have to take that into account by charging me more interest.
(There are other factors that affect loan interest rates as well. You may be thinking, "That can't be right. Credit cards are short term loans, but they charge 18% interest, while mortgages are long-term loans, and they charge only 7% or so interest. But the difference is that if you default on your mortgage, the bank gets your house (a mortgage is a secured loand), but if you default on your credit card loan, the bank gets nothing (a credit card loan is unsecured).)
As you probably know, the Federal Reserve "sets interest rates"; in fact, the Fed raised interest rates today by 0.25% to 1.75%. But the interest rate that the Fed sets is "the overnight funds rate" - the amount that one bank charges another for an overnight loan. The Fed does not attempt to control long-term interest rates (though it could -- see Federal Reserve congratulates itself on jawboning policy, for how the Fed could repurchase long term bonds.)
Normally, short-term and long-term rates go up or down together. But what happens if the Fed raises short term rates, but long-term rates go down instead of up? What does that mean?
Well, according to an 11-Jun-2004 Wall Street Journal article:
Before we explain why this is so troublesome, let's take a look at how much the yield curve has been flattening.
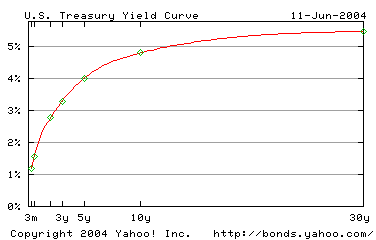
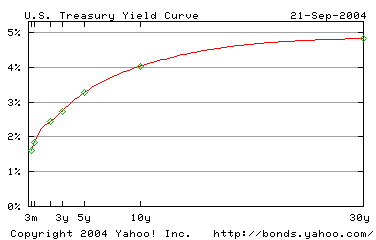
The "yield curve" is a graph of interest rates versus length of loan. As we said, the interest rates for a long term loan will be higher than for a short term loan, so the yield curve should show an increase.
Here are are the bond yield curves for June 11 and today (September 21):
 |
 |
Notice that the curve on the right is flatter than the one on the left.
Here are the interest rates for short and long-term bonds for four recent dates:
| Treasury Bond Yields | |||
|---|---|---|---|
| Date | 3-month maturity | 10-year maturity | Difference |
| May 11 | 0.94% | 4.74% | 3.80% |
| June 11 | 1.17% | 4.79% | 3.62% |
| Aug 21 | 1.38% | 4.23% | 2.85% |
| Sept 21 | 1.60% | 4.03% | 2.43% |
As you can see, the short-term rates have been increasing significantly, and the long-term rates have been decreasing significantly.
Today's Wall Street Journal had a front-page article titled "As Fed Ponders Another Rate Rise, Bonds Aren't Moving as Expected".
|
The article talks about the flattening bond yield, but no longer calls it "troubling," even though it's been going on for several months. Today's article contains phrases like, "that there is still softness in the economy," and "it's been a little puzzling," and "the market seems to be taking a darker view of the country's economic prospects than is Fed Chairman Alan Greenspan."
This vagueness isn't surprising, since we live in a world of journalists and analysts where there's never any bad news. If the stock market rises, it's good news because the stock market's rising; if the stock market falls, it's good news because investors now have inexpensive stocks to buy. Even the Wall Street Journal isn't going to discuss why flattening yield curves are bad news.
 |
The reasoning that a flattening yield curve is important is because it means that more and more people and businesses are selling their long-term assets (like their homes or their long-term bonds) in order to pay short-term debt (like credit cards). A person or business doing this is likely to be trying to stave off bankruptcy, but it also means that a lot of other people and businesses with no long-term assets to fall back on are going to be unable to pay short-term debt, and will indeed go bankrupt.
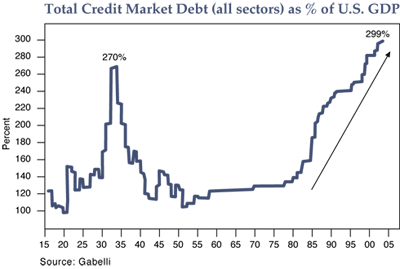
The fact is that public debt has been skyrocketing. We've seen nothing like it since the 1930s, as the adjoining graph shows.
As public debt increases, and more and more people default on their credit cards and mortgages, the flattening yield curve tells us that the market believes that a lot of people are going to go bankrupt in the next year, almost as many as in the next ten years. The only good news part of that statement is that it means that the market is saying that if you get through the next year or two, then you're almost as safe for the eight years following.
The Japanese stock market suffered a major crash in 1989. Since that time:
This is an incredible result. The 1.48% long-term interest rate means that there is almost no demand at all to borrow money long-term. This experience is being repeated in America.
 |
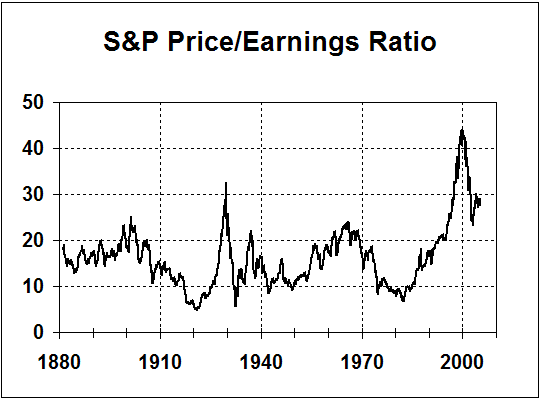
Public debt isn't the only thing that's been skyrocketing for the first time since the 1930s. The price/earnings ratios on stocks also spiked, just as it had after the 1929 stock market crash.
This means that the stocks are way overpriced, relatively to the amount of money that the companies are earning.
Historically, these kinds of price/earnings ratios indicate that stock prices are going to fall substantially, by as much as 50%.
Supposedly, the reason that the Fed must raise interest rates is to prevent inflation. But in fact, as we've discussed in the Web Log, both wholesale (producer) and consumer price increases have been falling for months, as shown by this table:
                        Changes from preceding month
                                    2004
                     Jan. Feb. Mar. Apr.  May June July  Aug
   ----------------- ---- ---- ---- ---- ---- ---- ---- ----
   PPI                .6    .1   .6   .7   .7  -.3   .1  -.1
   ----------------- ---- ---- ---- ---- ---- ---- ---- ----
   PPI "Core index"   .3   -.1   .3   .1   .4   .2   .1  -.1
   ----------------- ---- ---- ---- ---- ---- ---- ---- ----
   ----------------- ---- ---- ---- ---- ---- ---- ---- ----
   CPI                .5    .3   .5   .2   .6   .3  -.1   .1
   ----------------- ---- ---- ---- ---- ---- ---- ---- ----
   CPI "Core index"   .2    .2   .4   .3   .2   .1   .1   .1
   ----------------- ---- ---- ---- ---- ---- ---- ---- ----
As we've previously said, if you look at long-term trends instead of just a few months, we're actually in a long-term deflationary period. We actually expect prices to fall by 30% in the next few years.
This means that the Fed policy of combating inflation is dead wrong.